Last Updated on: 24th February 2025, 11:18 am
The task
Effective advertisement targeting includes multiple aspects in deciding which ad should be shown for the best effect. One thing to consider is the context in which the ad should be displayed. A classic example used in my team: advertisements for air travel should not be shown next to an article about a plane catastrophe, even if the basic keywords fit.
We need to be able to understand the context around the ad to avoid wrong ad placement and choose the best spot for user conversion. To do that, we monitor websites on which our core platform is active. Selected websites are scrapped for additional metadata. We collect website metadata in 43 languages. All of the collected data goes through multiple processors, which try to determine the context of the analyzed website before storing it in a data warehouse. The results are used by other parts of the RTB House ecosystem to provide the best advertising results for our clients.
This article will describe one of those processors, which we call the RTB House Percolator.
After the enrichment process, data is a mix of short strings, integers, and full-text blocks. The collected data includes well-formatted data structures but also, more often than not, human-generated content in natural language, which tends to be chaotic and unstructured. If a system deals with high-volume full-text processing (analyzing/searching), there is usually an Apache Lucene hidden somewhere. In our case, it’s Apache Solr—a well-known and battle-tested implementation of Apache Lucene.
We decided to go with Apache Solr instead of Elastic Search for two main reasons: Solr out-of-the-box supports more languages (43) than Elastic Search (36), and we needed to process as many languages as possible at once. The other reason was that Solr is open-sourced and has good support for plugins, which proved useful for us. Solr is also easily scalable and can handle large amounts of data.
The challenge: Scale
Our system processes logs generated by the core platform. We’re talking about 24*106 (million) logs per second. This number is quickly narrowed down through a number of clever filtering algorithms, but in the end, it’s still up to a few thousand new, unique logs every second. On a monthly scale, we process up to 5*109 unique logs. All of those logs need to be matched to over thirty thousand categories in the system. As fast as possible.
Additionally, the throughput of this log stream changes depending on the time of day in specific time zones. This kind of challenge required a state-of-the-art, fully scalable infrastructure and a few innovative in-house solutions, which will be described further in this post.
Infrastructure: To the cloud!
Let’s start with infrastructure. When dealing with systems that need to dynamically scale the number of machines, the most reasonable solution is creating such systems in the cloud. In this case, we decided to go with Google Cloud Platform.
For queue consumers, we used Spot VMs—preemptible machines. Pricing for this type of machine is dynamic and depends on demand. However, they are quite inexpensive, usually comprising about 10% of the cost of an on-demand machine, with peaks up to 30%. The trade-off is that preemptible machines live up to 24 hours and can be killed by Google Cloud Platform at any time. This quirk significantly impacts how we designed our queue consumers. Every process working on preemptible machines needs to be stateless, process small units of work at once, and handle termination gracefully.
Managing processes on multiple machines, which can be killed at any time, seems like a bit of a hassle. But that’s exactly what Kubernetes was created for. With Google Kubernetes Engine, we were able to create a set of interconnected clusters, each dedicated to a specific main task. These tasks are processed by multiple microservices within each cluster. Every cluster has multiple auto-scalable machine pools fitted to the service requirements. Processes (containers) are deployed to those clusters with a GitOps setup powered by Argo CD.
We operate multiple Kubernetes clusters with dedicated tasks, working together on the main goal: log classification based on metadata according to rules defined by operators and editors. To facilitate communication between these clusters, we use another service from Google Cloud Platform’s toolbox: Pub/Sub. Pub/Sub is particularly useful for enabling seamless communication between GCP data centers across the globe.
The final point worth mentioning in the infrastructure section is the topic of databases. This type of project requires two main types of databases. One needs to serve as a data warehouse, capable of handling large volumes of data and enabling easy processing, though at the cost of slower query execution times. BigQuery is the default tool for this purpose on Google Cloud Platform, and it works exceptionally well. The second type of database required in this type of project is a database optimized for fast data access rather than handling large datasets. For this, we chose a Cassandra-type NoSQL database
Apache Solr Cloud: Performance challenges
Given the large volume of data, we limited the traffic history retained in Solr to a short time window. But even with that constraint, the number of documents reaches 650 M, and the total index size exceeds 16 TB. This obviously creates some challenges which need to be addressed.
There are a number of more comprehensive articles about Solr configuration, so we’re not going to go over the standard set of config optimizations here. Instead, we’ll focus on the specific adjustments that delivered the greatest results in our case.
- Separation of indexing and querying on an infrastructure level. We achieved this with TLOG and PULL replicas, some rules in Solr Autoscaling, and a shard preference defined for queries. TLOG replicas can be leaders; PULL cannot, but they are great for searching. This allowed us to adjust the VMs resources to meet each part’s needs. The downside of this solution is that data becomes available for searching after a few seconds rather than instantly, as is the case with NRT replicas. In our case, this wasn’t a concern, as the system didn’t require real-time availability.
- Physical disks. On a large scale, Apache Solr search performance is directly tied to the speed of the drive attached to the machine. In our case, we used Local SSDs provided by GCP. While these drives have their drawbacks (they can be easily erased by accident), the latency and read/write speeds are worth it. To mitigate the risks, we located TLOG replicas on network drives and PULL replicas on Local SSDs. Thanks to this setup our index data is safe, yet we still utilize the full power of Local SSDs.
- Cache configuration. Due to the query/response characteristics, most of Solr’s built-in caches were useless for us, and cache warmers were generating unnecessary load on the system. We disabled certain caches (such as the query and document caches), while others, like the filter cache, were switched to CaffeineCache. The configuration was adjusted to reach a high hit ratio with minimal memory usage.
- Streaming Expressions and Export Handlers. Solr offers a stream processing language that allows us to perform calculations and transformations directly within Solr, rather than querying data for external processing. Streaming Expressions are also useful for retrieving large numbers of documents in a single request. With Streaming Expressions, the query response isn’t retained in Solr’s memory to be sent all at once. Instead, it’s streamed to clients directly as the results come from shards. Client applications can process documents one by one, as they come from Solr. This way of processing Solr responses saved a lot of memory.
Even with all of the above, we still experienced system performance issues, which only grew worse with increasing scale. It became clear that the idea of requesting large amounts of documents every minute—with complex, slow queries involving up to 4 K keywords at a time—and still needing to postprocess results is not the way to go. We needed another solution.
Solution: Baking with percolation
If you got here from a search engine looking for some molecular cuisine recipes, I need to disappoint you: this article is about data processing at scale 🙂
Baking is a term known in the CGI world and means preprocessing heavy tasks—such as calculating shaders and applying effects—to reduce final render times. This technique is widely used in 3D animation and game development. We decided to try a similar approach of partial preprocessing for the next steps in our text classification challenge.
To achieve this, we needed a way to test every incoming document against a stored set of queries. Elasticsearch offers a feature called Percolate Query, which allows you to upload a query in a specific format to the collection and then match it against incoming documents, returning a list of relevant queries.
While Elasticsearch’s Percolate Query was nearly a perfect fit, the limited number of supported languages was a deal-breaker for us. Percolate Query or its equivalent is not available in Solr by default, which pushed us to develop our own Apache Solr plugin—RTB House Percolator.
RTB House Percolator—“Decision Query Tree”
Our implementation of Percolate Query, like in the case of Elasticsearch, is based on a component of Apache Lucene—Lucene Monitor. Originally developed as Luwak Engine, Lucene Monitor is usually used to process incoming hardware/software logs in various types of alerting systems.
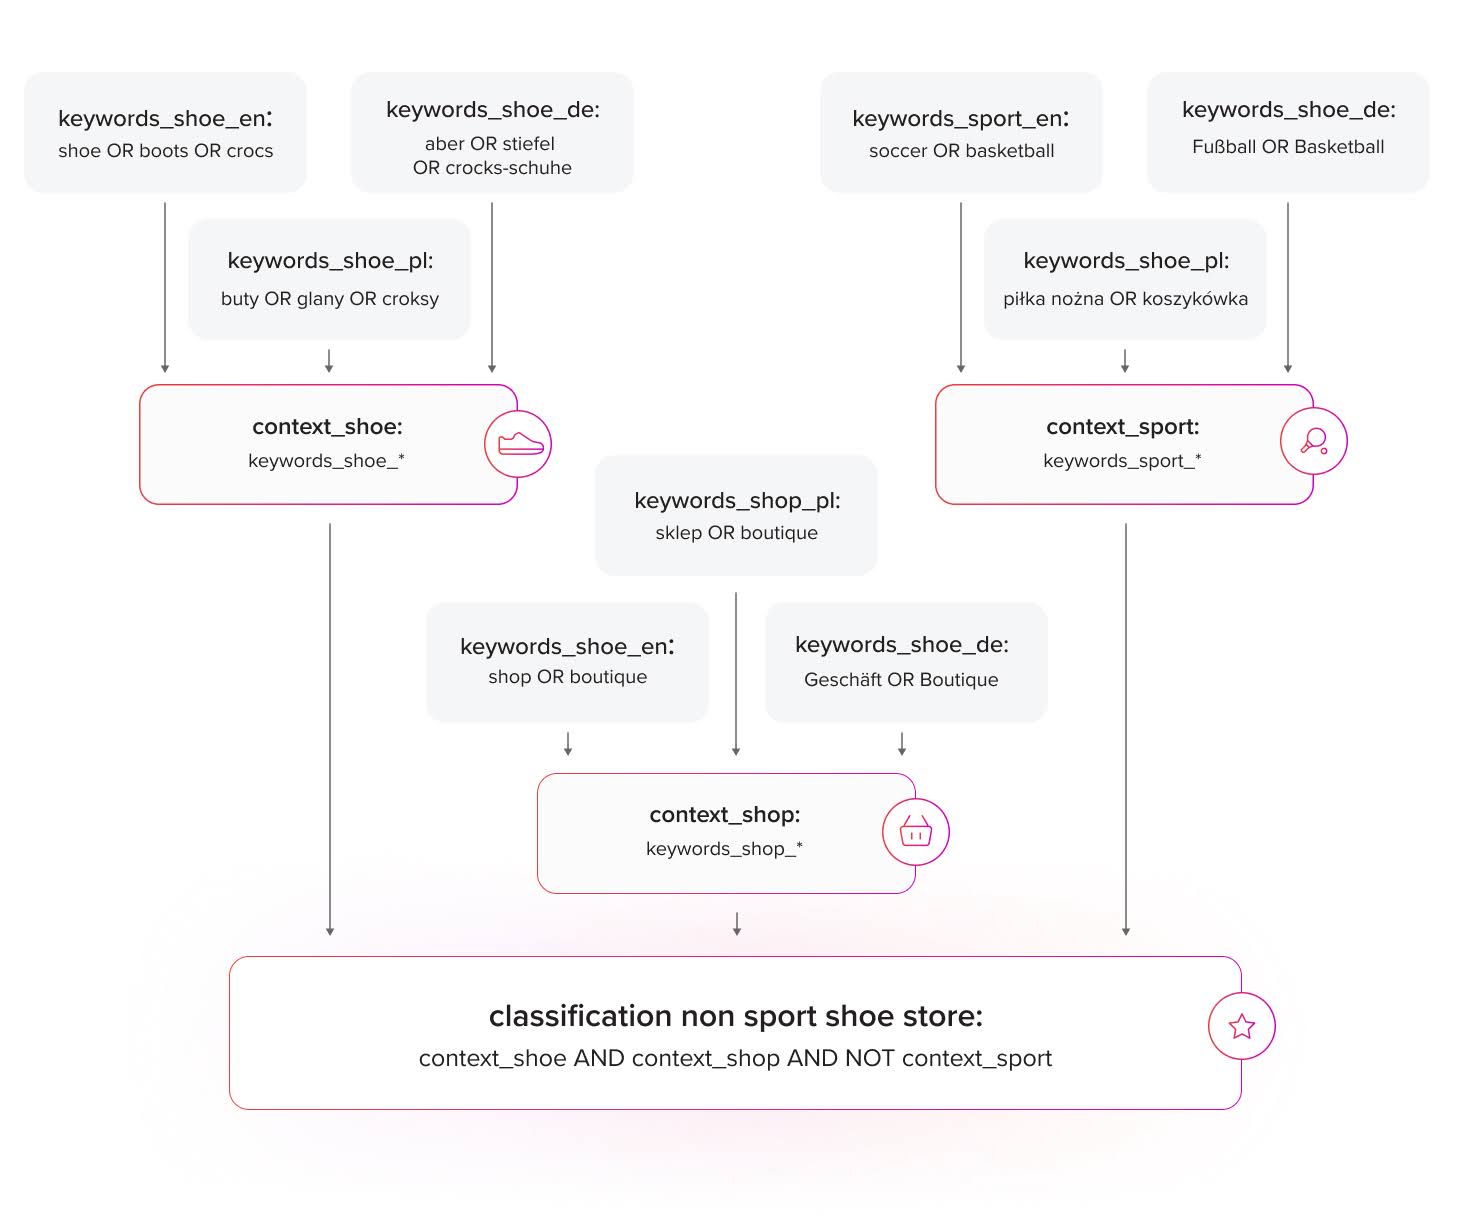
In our case, Lucene Monitor is used to analyze incoming documents and determine basic concepts that occur in documents, identifying key concepts within them and linking those concepts together to create a more complex classification strategy.
With RTB House Percolator, we were able to separate classification based on combinations of contexts from actual keywords occurring in the text. With this feature, context classification became language-independent. Additionally, this allowed us to keep queries short, improving overall system performance.
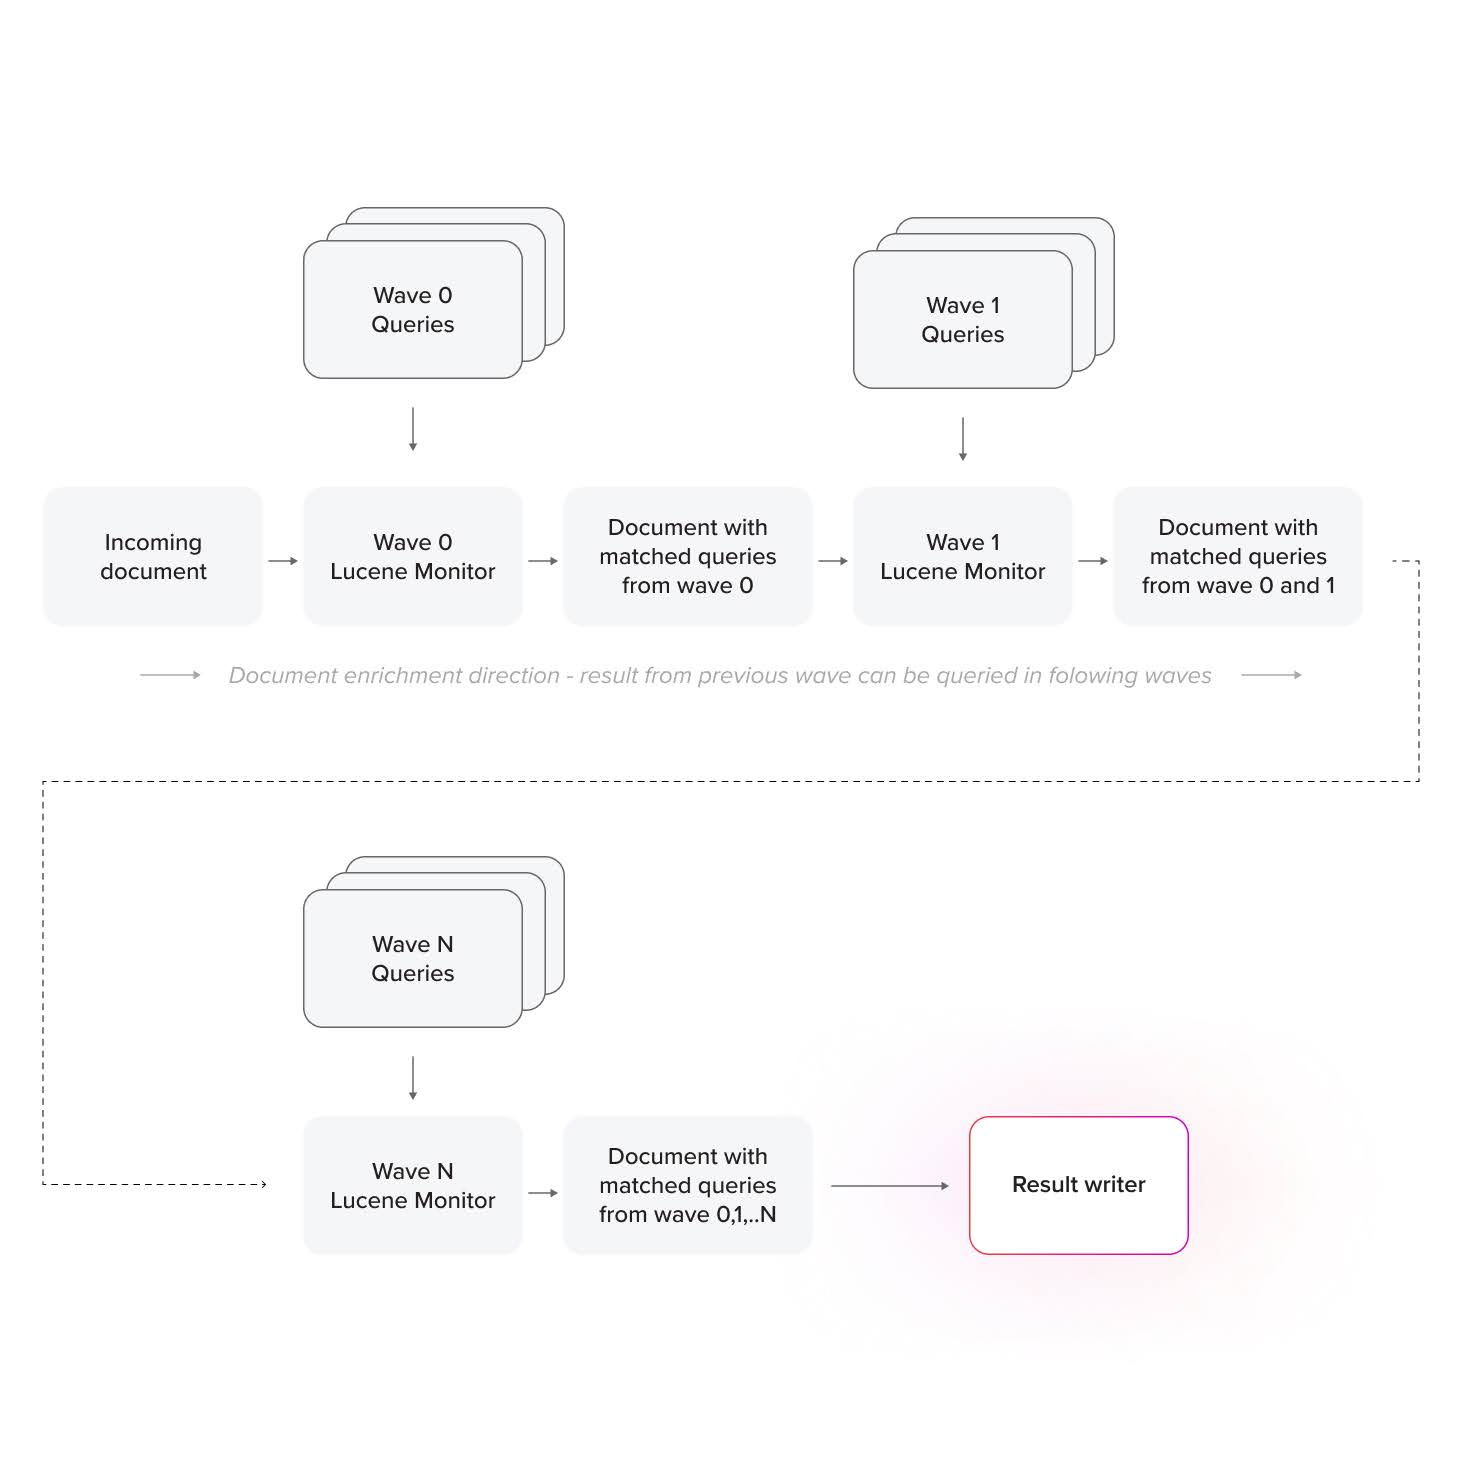
Incoming documents are first processed by a set of queries with keywords for each language. Each document is enriched with the results of the percolation. With these basic keywords, classification documents go through the next step of classification, whereas enriched documents undergo a full-text search of the next wave of queries. This process repeats multiple times, resulting in a complex, precise, and fully repeatable classification of an incoming document.
In effect, we percolate documents through a type of decision tree, but each node in this tree is a Lucene full-text query performed on the document and its fields.
How fast does it work?
We currently have almost 100 K queries for each of 43 supported languages, grouped in eight stages of document processing. This sums up to 4.3 M queries in a system. Average time of classification through all stages for a single 25 KB document: 50 ms (while processing documents in all 43 languages at once).
With multiple parallel document inserts and collection sharding in Solr we were able reach speeds up to 6.5 K documents per second, but that wasn’t a hard limit. The process itself is easily scalable, thanks to Solr Cloud and Kubernetes features.
The number of processing stages is easily configurable per collection, with some collections having only one layer of processing and others supporting multiple layers. The number of stages is only limited by the CPU and RAM of the hosting machine—and, of course, the developer’s imagination.
RTB House Percolator and multiple query testing passes allowed us to build complex classifications using simpler queries. In contrast, traditional querying methods would require long, complicated, and very slow queries or additional databases and jobs to combine results fetched from a normal index.
With this plugin, we were also able to bypass the traditional Solr bottle-neck: hard drive speeds. All queries are stored in RAM during percolation, so nothing is written to or read from disk. As a result, maximum performance is limited directly by the number of CPUs and memory assigned to the process, which is easily scalable in a cloud environment.
Percolation results handling
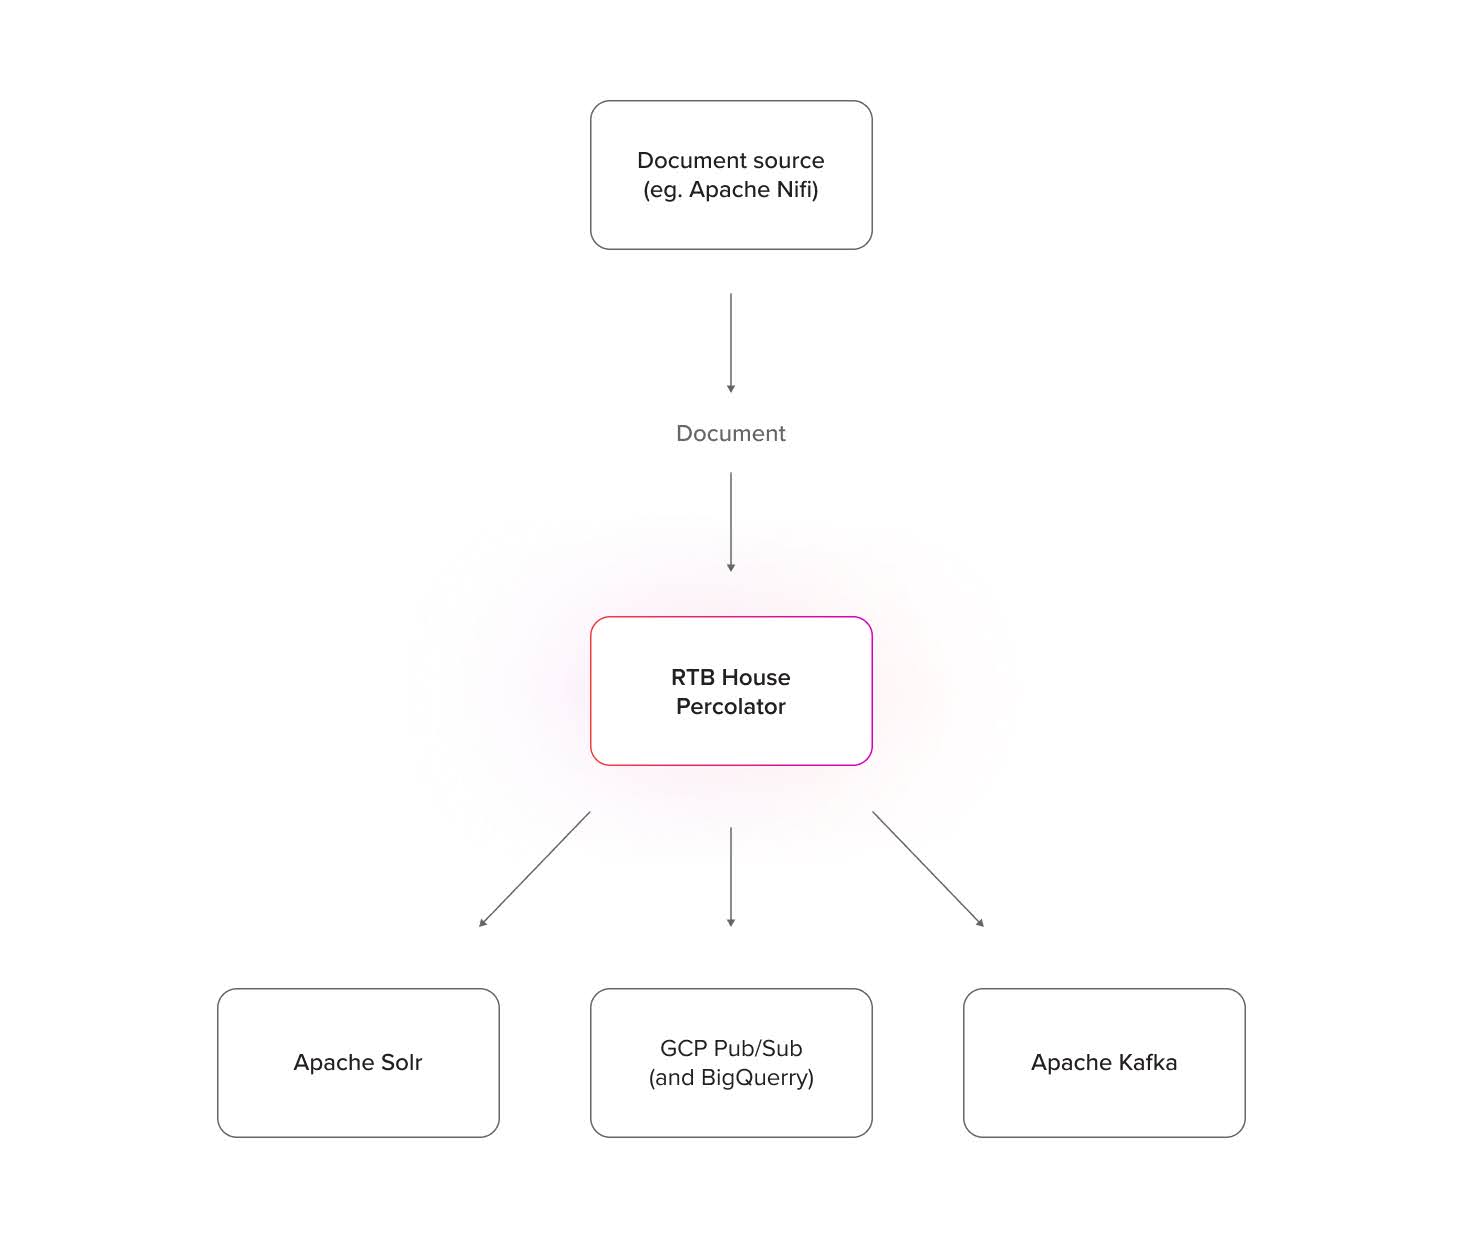
ElasticSearch’s percolation mechanism returns results to clients via HTTP response, requiring the client app to handle and process them. Our plugin takes a different approach by writing percolation results directly to multiple message queue systems, reducing complexity on the client side.
Currently, we support: Apache Kafka and GCP Pub/Sub. With Pub/Sub BigQuery Subscription we can also write data directly to BigQuery. Percolation results can also be stored in a Solr collection. Each writer instance operates independently, allowing multiple instances of each type to push data to separate topics or collections. New writers can be added to the codebase if needed.
Each percolator collection has its own set of possible writing destinations, and each query has a defined location where its results should be written. Queries at any level can produce output to a desired writing destination, allowing a single collection to generate independent percolation results for multiple systems. With this feature, our Percolator not only analyzes contexts and documents but also functions as a data stream router, with routing rules defined in the well-known Lucene query language.
Final thoughts
Apache Solr is a fast and versatile tool, but it comes with a steep learning curve and presents some challenges on a larger scale. However, with careful analysis of the system and its requirements, Solr can be configured to handle large amounts of data gracefully. With plugins like RTB House Percolator, Apache Solr can also be used to create high-throughput data processing pipelines or event-driven systems.