Last Updated on: 16th October 2024, 10:33 am
Introduction
As a global company, RTB House has data centers and server rooms spread across multiple locations (also see the series of articles on the L3 network).
Running workloads across multiple remote locations introduced a set of challenges. In this article, I will describe how we came up with a solution to one of the challenges: reliable collection and convenient display of logs from workloads running across multiple hosts and locations. Note that the problem of actual command execution across multiple hosts will be covered in another article.
Our assumptions
- A single workload (job) needs to execute commands in multiple processes and hosts in different locations.
- Network connectivity between hosts that run parts of the same workload might temporarily fail.
Requirements that we came up with based on our usage scenarios
Durability requirements:
Logs must not be lost in the following cases:
- Process crash.
- Server crash.
- Running out of disk space.
- Network failure.
Availability requirements:
- It is ok to block the process if we run out of disk space (in such case, we could either block or start dropping the log entries).
- The process should not be blocked due to a network outage (because it happens relatively frequently).
Logical scope requirements:
- We need a unified view of logs produced by multiple processes and multiple hosts executing parts of the same workload.
- We want to measure the duration of some subtasks, which are grouped into “subscopes.”
Our logs should be structured:
- Contain fields such as log level, process ID, variables substituted in the log message, etc.
- Multiline log messages should be supported.
Design based on requirements
The requirement to unify logs produced on behalf of a single workload but in multiple processes and hosts meant that we cannot use simple per-process log files to which each process writes its logs (we need a way to combine logs produced from multiple sources). Therefore, all logs are being transferred to a central logs database.
To fulfill our durability requirements, we decided that each log entry must be written down to disk synchronously (in a blocking way). Our availability requirement resulted in a decision that the log entries must persist locally (on the SSD drive of the host which executes the given command) so that the process would not block when logging a message while the network is down. As a result, the logs client will block until the log entry is written to a per-host logs queue. On each host, there is a log relay daemon which asynchronously transfers logs from the per-host queue to the central logs database. This transfer might be interrupted when the network fails and will be resumed after the network is working again.
We came up with the following idea for logical scopes:
- A logical scope is identified by a random unique identifier.
- Logical scopes might be nested and build a tree-like hierarchy. Each scope knows its parent scopes (up to the root scope).
- Each logical scope has a start time and end time.
- Each log entry belongs to a single logical scope.
Entries from multiple processes and hosts might belong to the same logical scope. Each workload creates its own unique scope, and all logs produced on behalf of that workload belong to that scope. This allows the unified logs viewer to show a unified view of all logs that belong to a workload.
The log viewer queries the central database and selects logs on the condition that they belong to our workload. Then, it sorts the selected entries by their timestamps.
The last requirement (“logs should be structured”) was the easiest one. We simply store each log entry as a JSON dictionary with proper keys such as log_level, pid, msg, etc.
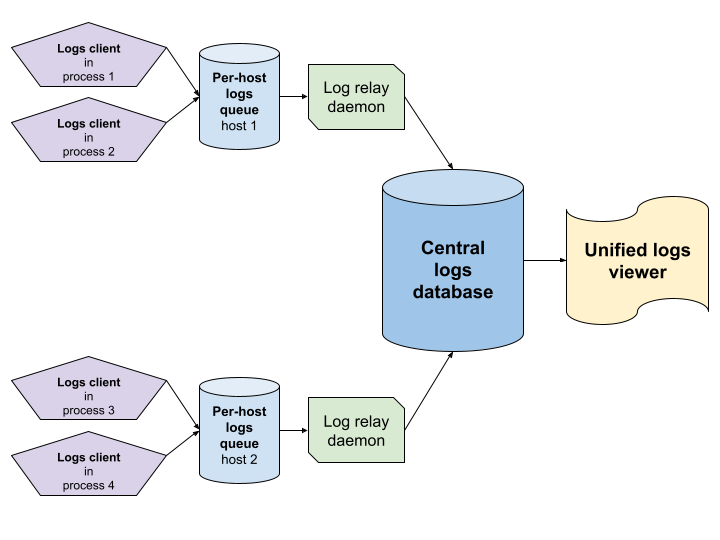
Components of our distributed logging system.
Implementation of the designed components
The job of the logs client is to encode a log entry into the proper (structured) format and write it down to a per-host logs queue. There can be multiple client implementations for multiple languages. Currently, we have an implementation for Python (using the standard logging framework) published here, and for C++ (using Google-style LOG macros).
At this stage, each log entry is a JSON dictionary stored with a unique key, so the logs are written down to a RocksDb (simple to use and performant key-value store), which serves as our per-host logs queue.
We have abstracted the implementation of the per-host logs queue by adding [an intermediate layer] that listens on a UNIX socket for the encoded log entries and writes them down to the RocksDb. This allows us to:
- Have a single writer process for RocksDb (which is a requirement for this database).
- Write the database-specific code only once.
- Detach the database-specific code from the language-specific clients.
The UNIX socket was chosen as an interface because it is a widely supported (in terms of programming languages), reliable, and fast inter-process interface.
The language-specific logs clients serialize the log entries as JSON dictionaries, send them to the well-known UNIX socket and wait for a confirmation that the message was successfully persisted.
The log relay daemon is implemented as a multiprocess system service written in Python.
The central logs database is the database that stores all the log entries collected from multiple hosts. We query logically related log entries from this database in order to present them to the user (in the unified logs viewer).
We were looking for a document database that can store arbitrary JSON objects. Support for efficient queries that would join log entries based on their logical scopes was essential. We considered MongoDb for a while, but eventually chose ArangoDb, which appeared to be simpler, more stable under load and offered a friendlier query language (AQL).
Our unified logs viewer is a Web-based JavaScript application that queries the central logs database to get relevant logs.
Usage examples
You can also fetch the examples from our GitHub repository.
Basic
User application written in Python.
from logger import get_rtbh_logger

my_logger = get_rtbh_logger(__name__)
my_logger.info("Hello")
Let’s see what data was written to our central logs database.
Here is the entry for our log message:
{
    "thread_id": "90a8dfa9-161c-47be-b62f-685907f13b47",
    "scope_id": null,
    "timestamp": 1713365816.7048306,
    "level": "INFO",
    "file": "basic.py",
    "line": 5,
    "message": "Hello",
    "args": [],
    [...]
}
Additionally, for each thread, the logger stores some per-thread metadata:
{
"hostname": "<hostname>",
"process_name": "examples/basic",
"pid": 921196,
"thread_id": 139682439864768,
"uid": "90a8dfa9-161c-47be-b62f-685907f13b47", // same as "thread_id" field on the message entry
[...]
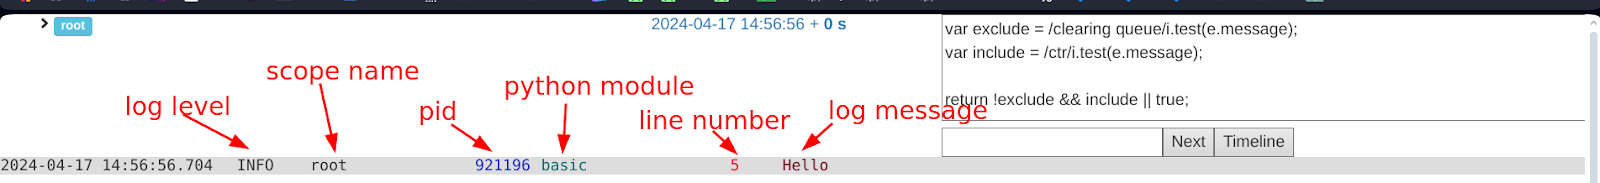
}This is what it looks like in our unified logs viewer. Note that we only show a subset of available data (e.g., the host name is not shown by default).
Subscopes
from logger import get_rtbh_logger
from logger.scope import new_scope, manual_scope

my_logger = get_rtbh_logger(__name__)

# subscope can be created for each function invocation

# if the function is decorated with `new_scope`

@new_scope
def function_in_a_subscope():
    import time
    time.sleep(1)  # Duration of the subscope will be also recorded and presented in the logs viewer.

function_in_a_subscope()

# there is also a context manager for creating a subscope
# that is not aligned with a function invocation boundary
with manual_scope("scope for only a couple of statements"):
    my_logger.info("I am now in a subscope")
    my_logger.info("Now I will exit the subscope")


my_logger.info("Now I am in the top scope again")
Let’s have a look at the database entry for a message in the subscope:
{
    "thread_id": "054bd1b5-56af-449c-b409-14305d6a3659",
    "scope_id": "39069f91-d3ba-413e-845f-2e0fae68c974",  // This was null for the top-level log
    "timestamp": 1713366784.432486,
    "level": "INFO",
    "file": "subscopes.py",
    "line": 20,
    "message": "I am now in a subscope",
    "args": [],
    [...]
}
We can see that this message has a non-null scope_id field. For each scope, we record a scope-start and a scope-end database entry. Let’s examine the scope-related database entries.
The scope start entry records the start time (or enter time) of a scope as well as the scope’s parents.
 {
    "uid": "39069f91-d3ba-413e-845f-2e0fae68c974",  // same as the "scope_id" field of the
message entry
    "scope_path": [
      // In case of nested scopes, this list would contain all parent scopes up to the root scope.
      {
        "uid": "39069f91-d3ba-413e-845f-2e0fae68c974",
        "name": "scope for only a couple of statements",
        "start_time": 1713366784.4322631,
        [...]
      }
    ],
    [...]
  }
The scope end entry only serves to record the end time (or exit time) of a scope:
{
    "uid": "39069f91-d3ba-413e-845f-2e0fae68c974",
    "end_time": 1713366784.4327323,
    [...]
}
And this is how the scopes are visualized in our unified logs viewer.
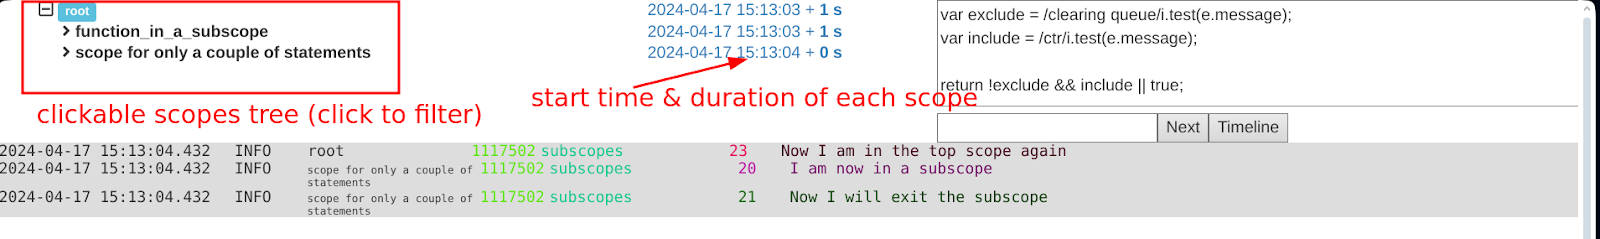
If any scope in the scope tree (top-left) is clicked, the log entries at the bottom part will only list logs from that selected scope.
Use across processes or hosts
Here, I show you how to use our logging system in a distributed way.
In order to “transfer” our logical scope to a different process, we specify its identifier on a special environment variable RTBH_LOGGER_SCOPE_ID. This variable is automatically read and respected by our client library. The child process can run either on the same host or on a different host (for example, using ssh).
distributed_parent.py:
# This is the top-level process.

import subprocess

from logger import get_rtbh_logger
from logger.scope import new_scope, get_current_scope_id
my_logger = get_rtbh_logger(__name__)

@new_scope
def function_that_runs_in_parent_process():
    my_logger.info("I am about to start a new process in the same logical scope")

    # For simplicity, I will demonstrate how to use the logger with multiple
    # processes on the same host. The subprocess could be actually executed
    # on a different host (e.g. using ssh) as long as the
    # RTBH_LOGGER_SCOPE_ID variable is properly set.
    # It would work the same way.
    # Note that the subprocess will inherit not only the top-level scope,
    # but also the subscope created by the invocation of the current function
    # `function_that_runs_in_parent_process` decorated with `@new_scope`.
    subprocess.check_output(f"""
        export RTBH_LOGGER_SCOPE_ID={get_current_scope_id()}
        python3 distributed_child.py
    """, shell=True)

    my_logger.info("I am in parent process, done with my child process.")


function_that_runs_in_parent_process()distributed_child.py:
# Setup is identical in child_process and in parent_process.
#
# This script doesn't need to know if it is run as top-level or
# as a child script from the logger's perspective.
#
# The environment variable RTBH_LOGGER_SCOPE_ID will be automatically
# detected and respected by our logger handler.
from logger import get_rtbh_logger
from logger.scope import new_scope

my_logger = get_rtbh_logger(__name__)
my_logger.info("Hello in child process")

@new_scope
def function_that_runs_in_child_process():
    my_logger.info("Hello in a child process in a subscope")

function_that_runs_in_child_process()
Let’s check the unified logs viewer:
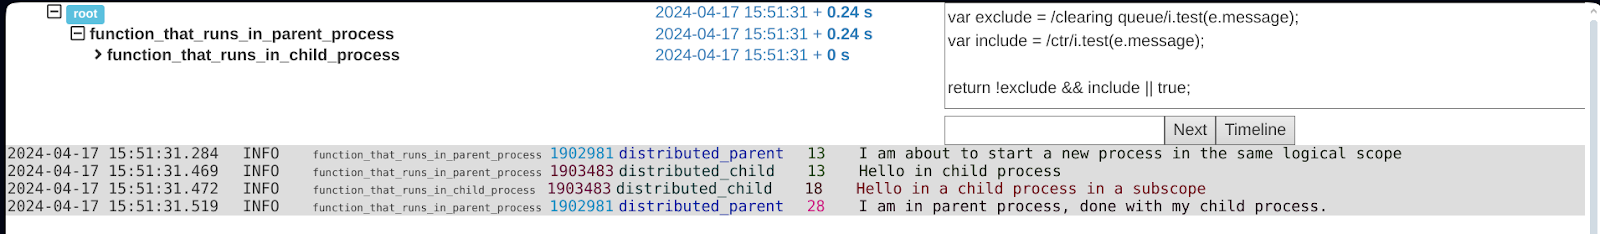
As you can see, the logs created by multiple processes (and possibly on multiple hosts) are combined together in the log viewer.
The logical scope from the parent process (function_that_runs_in_parent_process) is kept as a parent scope for the logs produced in the child process (function_that_runs_in_child_process).
Notice how we can distinguish between parent and child logs using the PID column of the log viewer (1902981 in case of parent process and 1903483 in case of child process).
Summary
The distributed logging system described in this article was designed to respect durability and availability requirements while providing a convenient way to view logically related log entries created on multiple hosts as a unified set of logs ordered by timestamps. It supports all the basic features of a modern structured logger and offers client libraries for Python and C++.
Credits and resources
The author and leading developer of the logging system: Paweł Wiejacha (RTB House).
The author of this article and the assistant developer: Hubert Tarasiuk (RTB House).
The Python client library and log relay daemon, as well as presented code examples, are available on GitHub. Note that for simplicity, some minor technical details of the implementation were not covered in this high-level description.